Welcome to our disquisition of the dynamic capabilities of real- time reports and dashboards within the Nonprofit Success Pack(NPSP). In this blog, we will dive into the inestimable tools NPSP offers to nonprofits, empowering them to harness data- driven perceptivity for enhanced decision- making, donor engagement, and functional effectiveness.
Understanding Real-Time Reports and Dashboards in NPSP
Real-time reports and dashboards in NPSP give immediate access to up-to-date data, enabling nonprofits to cover crucial criteria, track progress, and gain practicable perceptivity in real-time. Reports summarize data across multiple objects and can be added to dashboards.
NPSP Dashboard: Get Visibility into Your Fundraising and Campaign Performance
NPSP offers pre-built dashboards to provide visibility into fundraising and campaign performance over time. Key features include Development Analysis, Development Forecasting, Giving Range Analysis, and Campaign ROI Analysis.
- Development Analysis: Gain insights into giving trends by comparing donations from the current year to the past three years. Get a snapshot of recent and top donors with charts showcasing giving by different account and opportunity record types, as well as giving by GAU. Additionally, track the 25 most recent gifts and top 25 household and organization gifts.
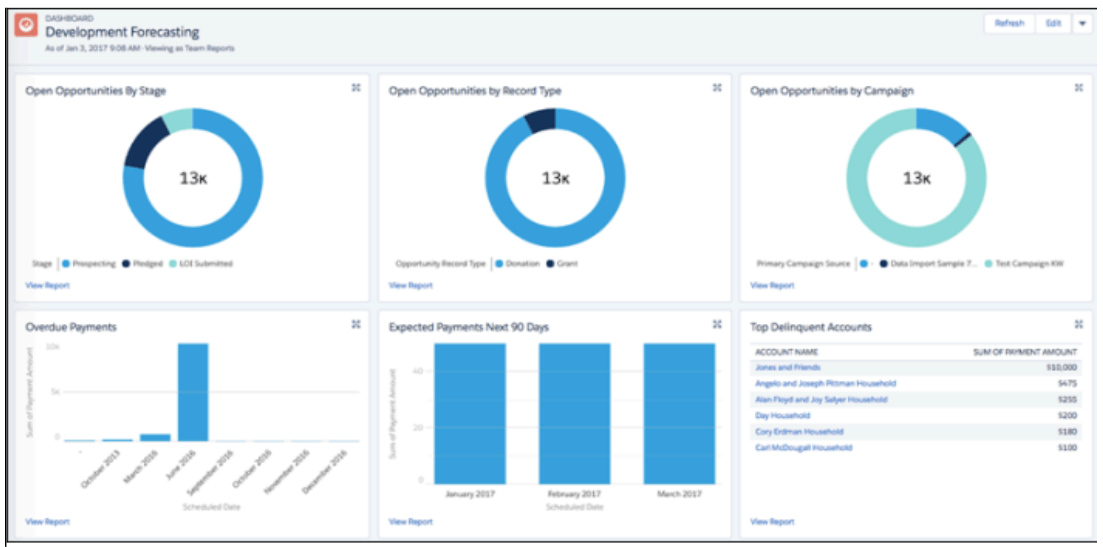
- Development Forecasting: Utilize real-time data to forecast future giving by examining your pipeline and identifying potential donors. Visualize open opportunities by stage, record type, and campaign, along with overdue and expected payments. Identify top delinquent accounts and track pipeline progress month by month. Also, analyze the giving history of households and organizations.
- Giving Range Analysis: Break down donor contributions into groups to identify patterns over time. Analyze giving amounts and donor counts for different ranges over the past two years and the current year.
- NPSP Campaign ROI Analysis: Evaluate the effectiveness of fundraising campaigns by comparing total donations and actual costs. Calculate metrics such as Return on Investment (ROI), Cost Per Donor (CPD), and Cost Per Dollar Raised. Assess the net per donor average donation and track the number of donations to measure campaign success.
Type of reports that you can leverage in NPSP are:
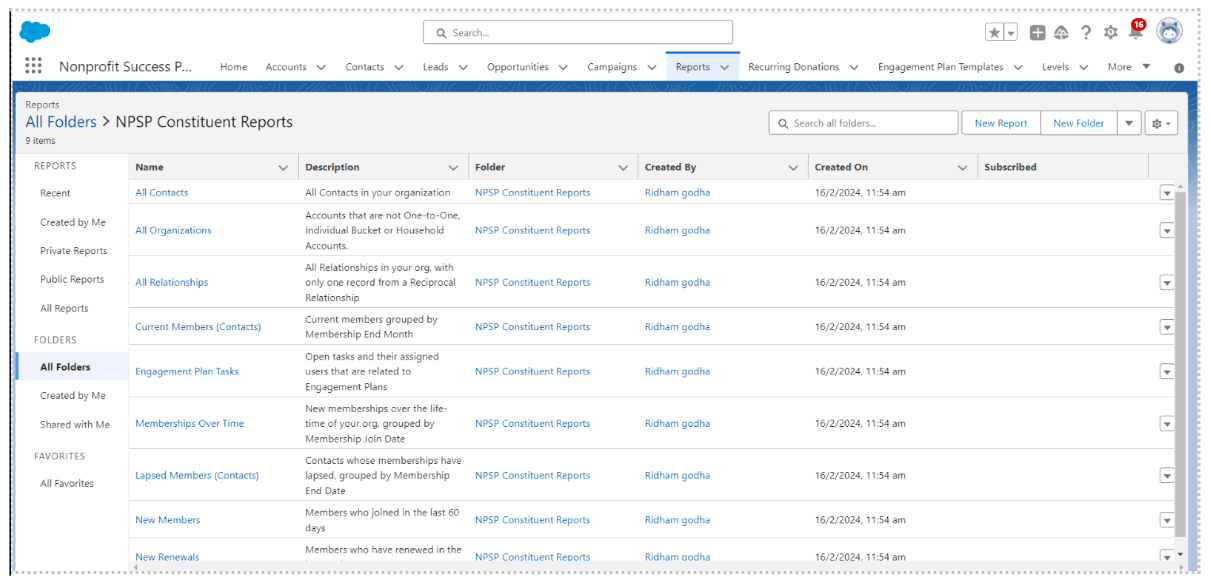
NPSP Constituent Reports
- All Contacts: All Contacts in your organization.
- All Organizations: Accounts that are not One-to-One, Individual Bucket, or Household Accounts.
- All Relationships: All Relationships in your org, with only one record from a Reciprocal Relationship.
- Current Members (Contacts): Current members grouped by Membership End Month.
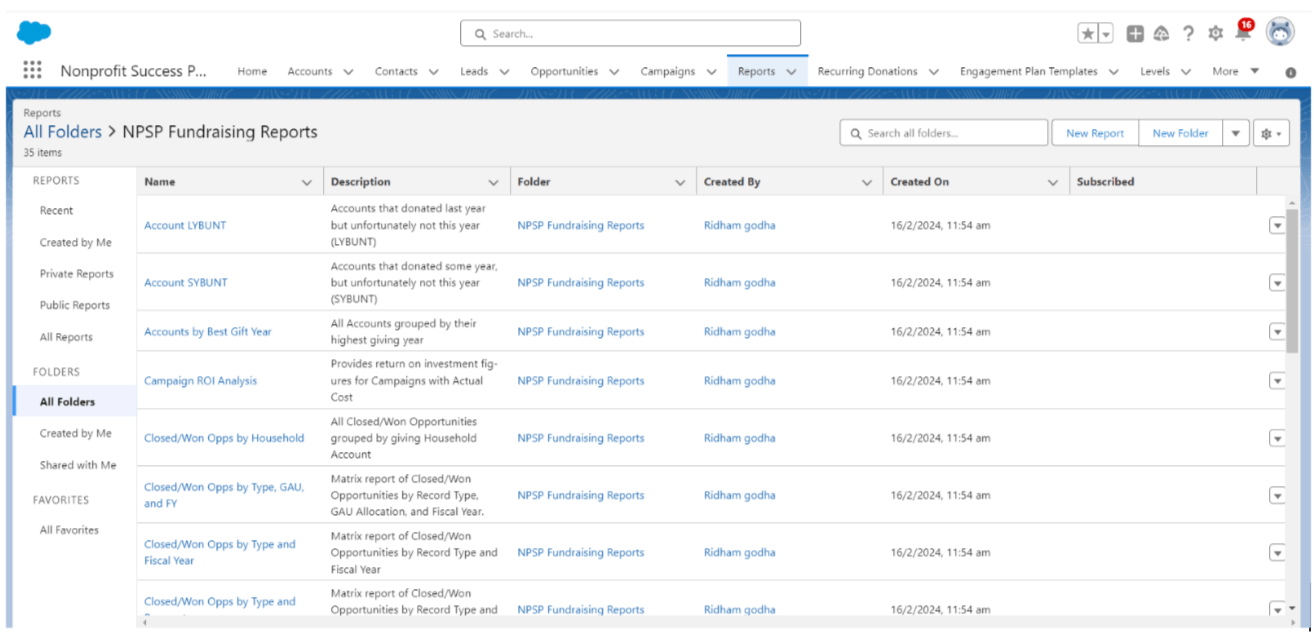
NPSP Fundraising Reports
- 10% Increase Projection: Projects a 10% increase in figures compared to both the Last Gift and the Total Gifts from the previous year.
- Account LYBUNT: Accounts that donated last year but did not do so this year. (LYBUNT).
- Account SYBUNT: Accounts that donated some year, but not in the current year (SYBUNT).
- Accounts by Best Gift Year: Group all accounts according to the year in which they made their highest contributions.
These examples showcase just a glimpse of the extensive range of reports available in NPSP, empowering organizations with robust data analysis capabilities to optimize their fundraising strategies.
Pre-Installation Checks:
Before diving into the installation process for the new Reports, it is crucial to ensure that your Reports and Dashboards settings are properly configured and that your organization contains a Grant record type. Neglecting these prerequisites could lead to installation failures. Here is what you need to do:
Access Setup:
- Start by clicking on the Setup icon.
Verify Reports and Dashboards Settings:
- Enter “Reports and Dashboards” into the Quick Find search bar and then choose “Reports and Dashboards Settings” from the results.
- On the Reports and Dashboards Settings page, look for an “Enable” button, especially if you are working with older orgs. Click it if present. If not, proceed to the next step.
Confirm Grant Record Type:
- Navigate to the Object Manager tab.
- Select “Opportunity” from the list of objects and then click on “Record Types.”
- Check if there is a record type named “Grant.” If not, you will need to create one. Ensure to use “Grant” for both the Record Type Label and Record Type Name.
It is important to note that the user installing the Reports package must possess a System Administrator profile. This profile grants all the necessary permissions for successful package installation. Attempting installation with a profile lacking essential permissions will result in errors.
Installation Process:
If you initiated a Trial of NPSP before version 3.90 (February 2017) or installed NPSP without starting from a Trial version, installing the NPSP reports in your organization is required. Here is how to proceed:
- Visit the NPSP Reports & Dashboards Installer (https://install.salesforce.org/products/npsp/latest/reports).
- Log in using your Salesforce organization credentials.
- Click on “Install.”
Handling Old NPSP Reports and Folders:
For organizations with existing old report folders, it’s advisable to gradually phase them out by hiding them from regular users while keeping them accessible to administrators. This approach ensures that old reports remain available if needed but reduces clutter for everyday users. Once users no longer require access to old reports for a defined period, you can consider deleting the folders and reports altogether.
Advantages of Real-Time Reports and Dashboards:
Real-time reports and dashboards offer numerous advantages to nonprofits:
- Timely Decision-Making: With real- time access to data, nonprofit leaders can make informed opinions instantly, responding swiftly to changing circumstances and maximizing opportunities.
- Enhanced Donor Engagement: Real- time insights enable nonprofits to understand donor behavior, preferences, and engagement situations, facilitating substantiated communication and targeted fundraising efforts.
- Performance Monitoring: Dashboards give a centralized hub for covering crucial performance pointers (KPIs), program outcomes, and fundraising progress, empowering nonprofits to track performance against goals and objects.
- Transparency and Accountability: By participating in real- time reports and dashboards with stakeholders, nonprofits foster transparency and accountability, building trust and confidence in their charge and impact.
In conclusion, leveraging real-time reports and dashboards in NPSP is essential for nonprofit organizations to maximize their impact and drive positive change. By providing stakeholders with immediate access to critical data and empowering proactive decision-making, NPSP’s reporting, and dashboard tools enable organizations to monitor performance, track progress, and respond swiftly to emerging trends.
Leave A Comment