Einstein Analytics is a self-service application, which provides the functionality to work on a large amount of data. Here, we can explore our data to discover something new. We can instantly visualize our data and can show how we are doing in our business and what’s the possibility for next month or year, we can also create a dashboard to visualize the latest data.
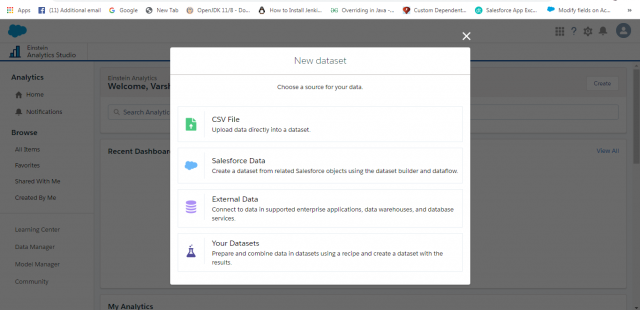
Einstein Analytics provides the capability to create aggregated views of all data whether it is coming from Salesforce Data, External Data, CSV File, etc. See below in the attached screenshot. To aggregate it, you need to load Dataset. Now, you can easily visualize and explore your data from the business dataset.
Einstein Analytics comes with 3 layers i.e. Data Layer, Design Layer, and Intelligent Layer, which I am going to explain one by one.
Data Layer – Data Manager
The data manager is where you monitor your data jobs, prepare datasets with recipes/prep, Dataflows editor, and Data Sync/Connect. Dataset Builder (the simplest way to create Dataset on an object is from local org)
Dataset Builder (simplest way to create Dataset on an object is from local org)
Prerequisites: Make Sure you Enable Data Sync
Setup -> Analytic -> Setting -> Check Enable Data Sync
Once Data Sync is Enabled, you will able to see Connect and Recipes under Data Manager
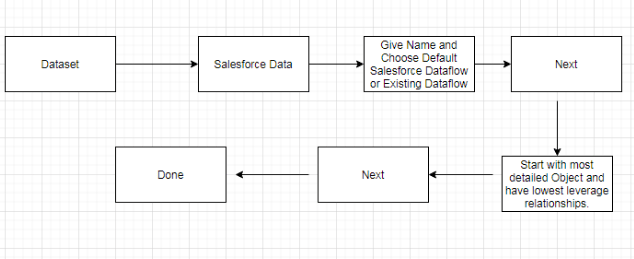
Dataset Builder Tips
Dataset Builder helps in understanding the lowest grain with respect to the dataset, you will realize when you are dealing with unfamiliar org or custom object.
For Example: If you go to the selected object and don’t see the next object you need, it means you started at the wrong grain. Let’s take an example, how many datasets typically you need here? So, First Calculate which object is more detailed than others. Arrow -> refers to the lookup relationship between the object.

We have a lot of products; Opportunity may have a product or may not have products and products can’t exist without Opportunity. Similarly, every opportunity has an owner (user) but not every user is associated with Opportunity. So, Product is the lowest grain, and Opportunity is lower grain than Account.
I think 4 datasets we need here. DS1: All product dataset including Opportunity, Account, and Users. DS2: All Opportunity dataset with Account and Users. DS3: All Users Dataset. DS4: All Account dataset.
Dataflow
Dataflow is a file that creates an instruction to create the dataset and can do some transformation as data is being read and moved around. When you create dataset through dataset builder, instruction gets automatically added to dataflow in the format which describes objects, fields, and transformations. When dataflow runs, the data engine executes the instruction of the file and creates the final dataset. You can run dataflow manually or based on scheduled time but make sure dataflow run after sync finishes. We can download, back-up, or edit.
Data Prep/Recipes
Data Prep/Recipes is a friendly UI tool for creating and preparing clean data. It always starts with one or multiple datasets and ends with a single dataset. It always matters when we have a large number of data. For Example, You have 40 million rows and you want to add or append 20 million more rows then go for multiple datasets and end with dataset having 60 million rows. Make sure to always run or scheduled recipes after the dependent workflow finishes running.
Designing Layer Basics
When Einstein analytic home page opens, you will able to see App, lenses, and dashboard, all these come under the designing layer. Let’s discuss all these:
- Lens: Lens is used to explore the dataset. Most of the time we explore lenses within the dashboard.
- Dashboard: Dashboard contains widgets, lenses, charts, text, etc. We can use a dashboard designer to design dashboards.
- App: App is a collection of datasets, lenses, dashboards related to business purposes. It is like a folder. The app can be shared or private.
Intelligent Layer Basics
Einstein Analytics comes with an Intelligent layer. We can create a story or multiple stories from the dataset, analyze what happened, why it happened and perform an action after multiple iterations and give outcome, then deploy story to end user in the target object.
Steps for Create Story and Deploy
Go to Dataset -> Create Story -> Open Story Tab -> Deploy
Leave A Comment