We have heard about many Health Check tools, either you’re looking to assess and resolve performance issues in the Salesforce implementations or to have real-time access to performance metrics; here’s the Scale Center feature with all in one capabilities.
The Scale Center proves valuable throughout the development cycle, aiding in readiness for production deployment through performance testing in sandboxes, evaluating post-deployment effects, and conducting proactive monitoring during peak times.
The Scale Center feature is available in all Salesforce editions, including Enterprise, Performance, and Unlimited. It is also available in both 1P and Hyperforce environments.
Key Features of Scale CenterKey Features of Scale Center
- A comprehensive view of org performance metrics: Scale Center offers a holistic perspective on organizational performance metrics, presenting a unified interface to observe prevalent errors such as failed logins, concurrent Apex errors, and Rowlock errors. Furthermore, users can access key metrics like Database CPU Time, Average Request Time, and Total Errors presented in charts spanning the specified time interval.
- Near real-time performance updates: Scale Center provides near real-time updates on org performance, so users can quickly identify and address issues as they arise.
- Actionable insights and recommendations: Scale Center provides actionable insights and recommendations to help users resolve performance issues. These insights can be based on historical data, as well as real-time trends. This proactive approach helps prevent performance outages and ensures a consistently optimal user experience.
Getting Started with Scale CenterGetting Started with Scale Center
To enable Scale Center for your org, follow these steps:
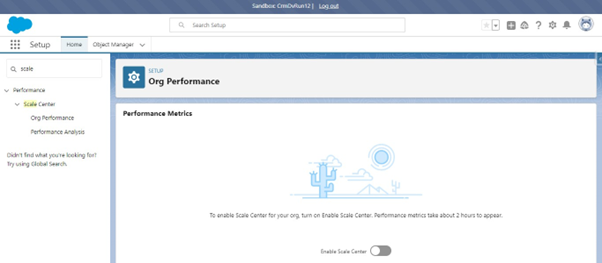
- From Setup, in the Quick Find box, enter Scale Center, and then click Scale Center.
- To enable Scale Center for your org, turn on Enable Scale Center.

Once Scale Center is enabled, you can access it from the Setup menu.
You will be able to use the below mentioned features of the Scale Center.Once Scale Center is enabled, you can access it from the Setup menu. You will be able to use the below mentioned features of the Scale Center.
- Org Performance
- Performance Analysis
Also, the Scale Center Standard Permission Set is created automatically which can be assigned to the Non Admin users to be able to use Scale Center.
Org Performance
The Scale Center Org Performance is to monitor and analyze you Salesforce organization by generating different charts mentioned below:
Successful Logins: This metric represents the total number of successful logins to your system.
Failed Logins: This metric indicates the total number of unsuccessful login attempts. A high number of failed logins may suggest potential network issues or security concerns.
Concurrent Apex Errors: This metric monitors the count of synchronous Apex requests surpassing a predefined time threshold (5 seconds) and surpassing the governor limits due to inefficient SOQL queries, inadequately coded Apex, or synchronous callouts from Visualforce pages within your organization.
Concurrent UI Errors: This metric tallies the instances of UI requests extending beyond 10 seconds and surpassing the governor limits within your organization.Also, helps you to find the potential reasons of delayed dashboard refreshes or prolonged execution of reports or dashboards.
Row Lock Errors: This metric tracks the count of exceptions triggered when there are concurrent attempts to update a particular record. Potential reasons include parent-child data imbalances, unsuccessful API or Apex triggers, or timeouts during multiple Email-to-Case updates.
Total Callout Errors: This metric tracks the number of errors encountered when making callouts to external, third-party packages or managed packages. It helps identify issues related to external integrations or dependencies.
This will let you have a summary of your organization’s performance metrics within a specified time frame or compare two different time frames.

Within Org Performance analysis, it’s possible to contrast two distinct time spans: the base time range and the comparison time range, denoted by their respective start and end times (A and B). By generating this comparison, users can obtain a snapshot of essential performance metrics and discern the corresponding increase or decrease for each metric.

Performance Analysis
The Scale Center’s Performance Analysis is to address errors or sudden increases reported in an organization’s performance query, and to generate a performance analysis report for troubleshooting purposes.
Reports generated from the Org performance are accessible on the Performance Analysis page, including the details such as analysis type, requestor, Requested on, and the start date and end date of the analysis window.
The Analysis can be generated of multiple types listed below as well as shown in the fig 1.4:
- Apex ConcurrencyApex Concurrency
- Apex Summary
- Database Performance
- Failed Logins
- Flow Performance
- Governor Limits
- Integrations Performance
- List Views and Reports
- Row Lock

The Apex Summary report is generated as shown below in fig 1.5.

Opening up a report, you can see:
- Users can find the SOQL queries that have contributed to the increased database consumption (top-right) on the top right section.
- Additionally, it breaks down the record types accountable for database calls both actual counts and the percentage of the total.
- The top entry points.
- The users who have caused the database spike.
Notes & Limitations
- The time frames exceeding 12 hours may require several minutes to load.
- Performance metrics take about 2 hours to appear.
- Time range up to 24 h duration and up to 30 days of history
- 1 Analysis report can be created at a time and 3 reports can be generated in the last 24 hours.
Summary
By leveraging Scale Center’s capabilities, developers and administrators can significantly enhance the scalability of their Salesforce implementations, ensuring that their orgs can handle growing workloads and maintain optimal performance under peak demand. This translates into a faster, more responsive user experience, fostering increased productivity and satisfaction.
In essence, Salesforce Scale Center transforms performance optimization from a specialized task into an integral part of the development and administration process, empowering everyone to contribute to a high-performing Salesforce experience.

Leave A Comment