
Agentic AI Security: Tool Poisoning and Audit Trails
Explore agentic AI security risks, including MCP tool poisoning, and learn how governance, permissions, approvals, and audit trails reduce exposure.
Reports and dashboards in Salesforce are powerful tools designed to help users analyze, visualize, and interpret data within the CRM platform. These tools play a crucial role in transforming raw data into meaningful insights, enabling informed decision-making and strategic planning.
In addition to their analytical prowess, Salesforce reports offer customizable data filters and sorting options, ensuring users can tailor their views to specific criteria. Dashboards further enhance the user experience by consolidating multiple reports and key performance indicators into a single, cohesive
interface.
To create a report in Salesforce, navigate to the ‘Reports’ tab, choose the desired report type, set
criteria, and follow the intuitive steps provided by the platform for customization and analysis. Please refer to FIG.
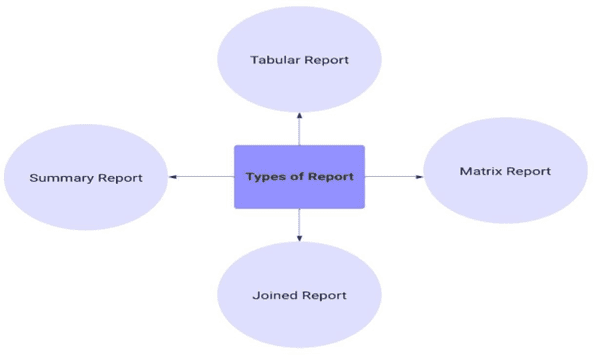
Salesforce offers a variety of report types, each serving specific analytical needs. Here are some common types:
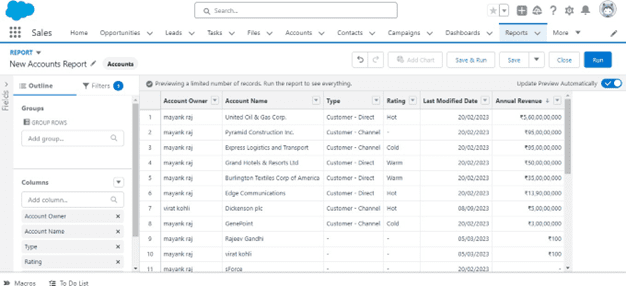
Tabular reports are the most straightforward type, presenting data in a table format. They provide a basic listing of records with columns that you can customize. These reports are used to list object records like account, opportunities, contacts, etc. Please Refer Fig
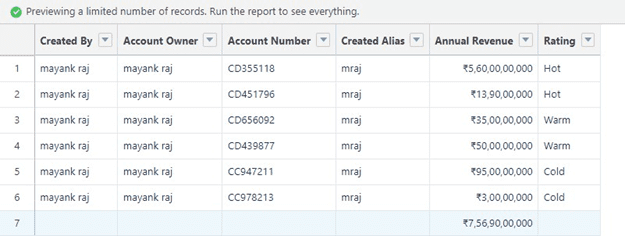
Summary reports aggregate data to provide a higher-level overview. They often include subtotals and grand totals, making them ideal for analyzing data at various levels of granularity. Please Refer Fig.
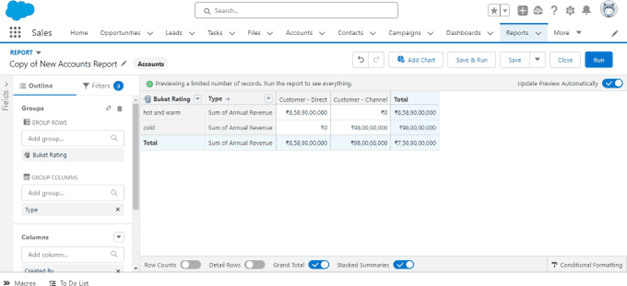
Matrix reports allow users to group and summarize data both vertically and horizontally. They provide a comprehensive view of information, making it easier to identify patterns and relationships. Please Refer Fig
Joined reports merge data from multiple report types into a single view. A joined report allows you to show data that share a relationship with one or more objects. Joined reports become particularly useful in scenarios where objects lack a parent-child relationship, as is often the case with entities likeAccounts, cases and Opportunities. Please refer to Figure
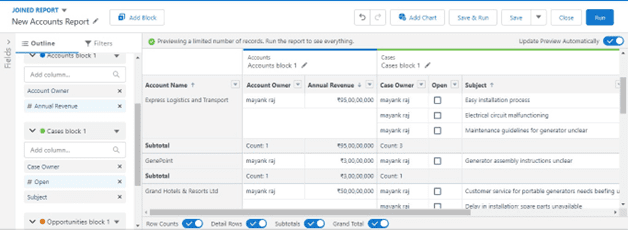
Salesforce provides prebuild ready-to-use Report Types, which is awesome, but they might not cover every specific requirement you have. Unfortunately, you can’t tweak the preset Report Types directly.
However, you can create your own reports with Custom Report Types. These let you decide exactly what you want to see in terms of objects and fields.
Dashboards in Salesforce serve as visual representations of key metrics and insights derived from
reports. They consolidate multiple reports onto a single screen, providing a comprehensive overview of an organization’s performance.
Salesforce dashboards consist of dynamic components, such as charts and metrics, providing a visually intuitive snapshot of real-time sales and business data. Please Refer Fig
Reports: Dashboards are built on reports, which serve as the foundation for data visualization. Users can select relevant reports to display on the dashboard, allowing for a tailored representation of critical
information.
Charts and Graphs: Dashboards leverage a variety of chart types, such as bar charts, pie charts, and line graphs, to visually represent data. These visualizations make it easier to identify trends, anomalies, and patterns in the data.
Metrics and Key Performance Indicators (KPIs): Users can add metrics and KPIs to highlight specific values or performance indicators directly on the dashboard. This enables quick assessment of key business metrics without the need to delve into detailed reports.
Gauges and Indicators: Gauges and indicators provide a quick, visual representation of performance against predefined benchmarks or targets. They help users understand whether certain metrics are within acceptable ranges or require attention.
Filtering and Interactivity: Dashboards often include interactive elements, such as filters and drill-down options, allowing users to focus on specific subsets of data. This interactivity enhances the user experience and ensures that dashboards remain versatile and adaptable to changing needs.
Row and Grouping Limits:
Data Display and Visualization:
Mobile and User Interface:
Widget and Component Limits:
Dynamic Dashboard Limits:
Salesforce reports and dashboards are integral components of modern business operations, providing a comprehensive and intuitive approach to data analysis. As organizations strive to stay competitive and agile, leveraging these tools becomes essential for unlocking valuable insights that drive success in today’s fast-paced business environment.
Get Started
Share a few details about your goals: a Mirketa consultant will follow up within one business day.
 Certified Partner
 SOC 2 Certified
 HIPAA Ready
 Enterprise Ready