
Agentic AI Security: Tool Poisoning and Audit Trails
Explore agentic AI security risks, including MCP tool poisoning, and learn how governance, permissions, approvals, and audit trails reduce exposure.
Recently I worked on projects where I had to customize the standard graph elements to create an engaging experience on the consumer portal. In this post, I will be sharing my experience with Salesforce data visualization and charting.
If you are not happy with the default charts, you can create your own custom charts. However, creating charts from scratch requires substantial scripting work. It can be a pain in the b***t to ensure that the charts work fine on different browsers. I recommend customizing standard charts offered by other provides. Try some of the JS based charts that can be customized in the Visualforce environment.
There are plenty of options available online. Unfortunately, most are paid. I liked the objects offered by JQchart, primarily because they are FREE! jqChart takes advantage of HTML5 Canvas to deliver high performance client-side charts and graphs across browsers (IE 6+, Firefox, Chrome, Opera, Safari) and devices, including iOS and Android mobile devices. As full disclosure, I don’t get paid by jqChart. :).
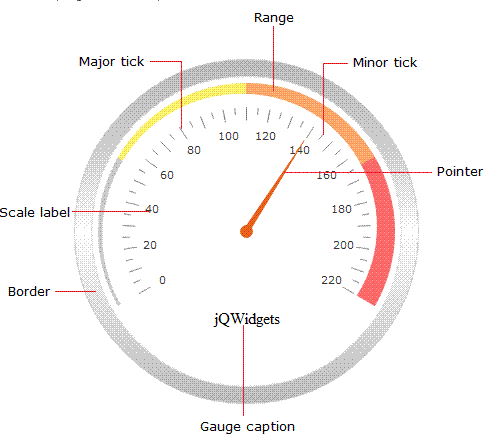
Here are a couple of sample charts from jqChart that I used for our custom work. To these graphs, we made some functional and visual changes.
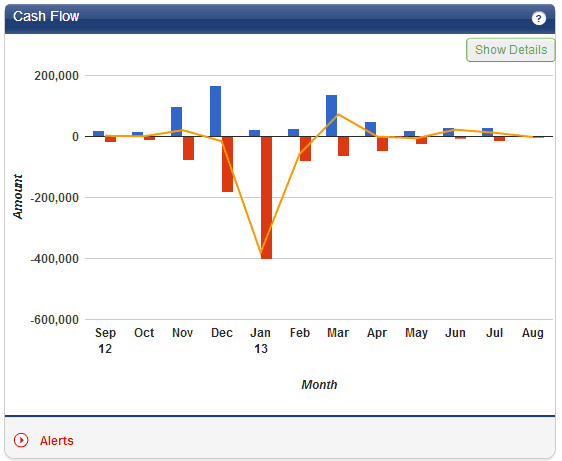
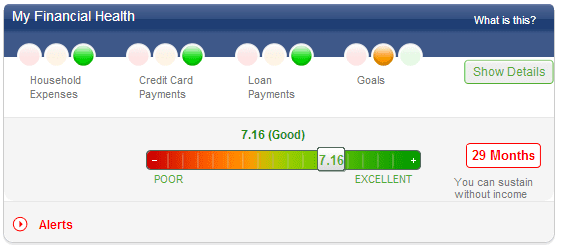
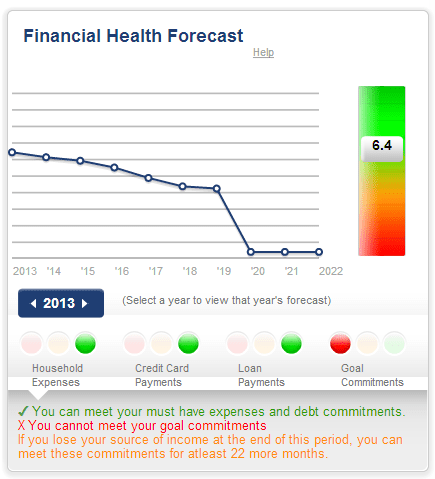
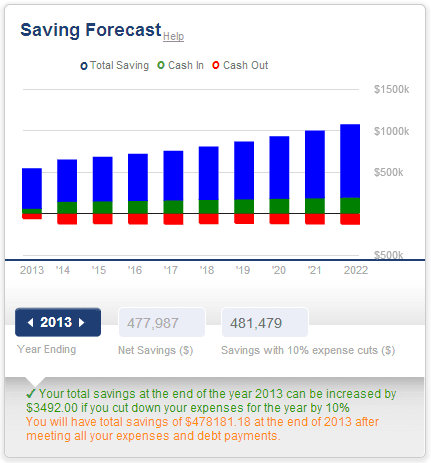
The following are the examples of other charts that my colleagues built from scratch for our financial planning product. As I said before, we spent a lot on time making sure that these graphs worked fine on different browsers. So I don’t recommend building Salesforce Charts from scratch unless you have no other option.
Get Started
Share a few details about your goals: a Mirketa consultant will follow up within one business day.
 Certified Partner
 SOC 2 Certified
 HIPAA Ready
 Enterprise Ready